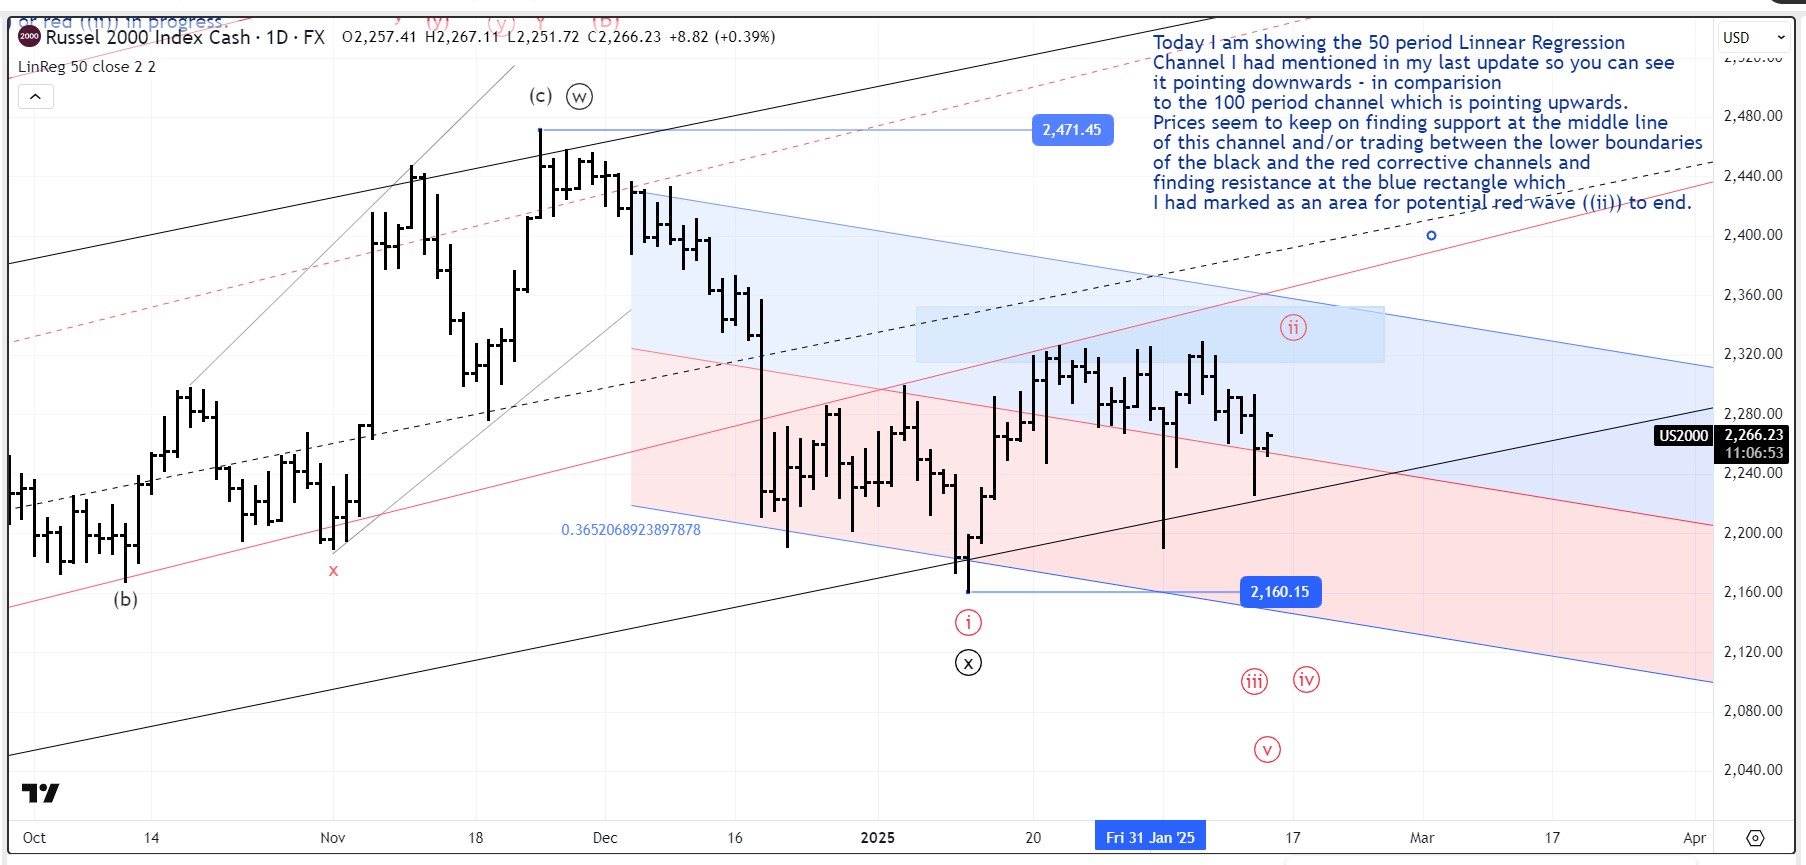
Today I am showing the 50 period Linear Regression Channel I had mentioned in my last update so you can see it pointing downwards – in comparison to the 100 period channel which is pointing upwards. Prices seem to keep …
Today I am showing the 50 period Linear Regression Channel I had mentioned in my last update so you can see it pointing downwards – in comparison to the 100 period channel which is pointing upwards. Prices seem to keep …
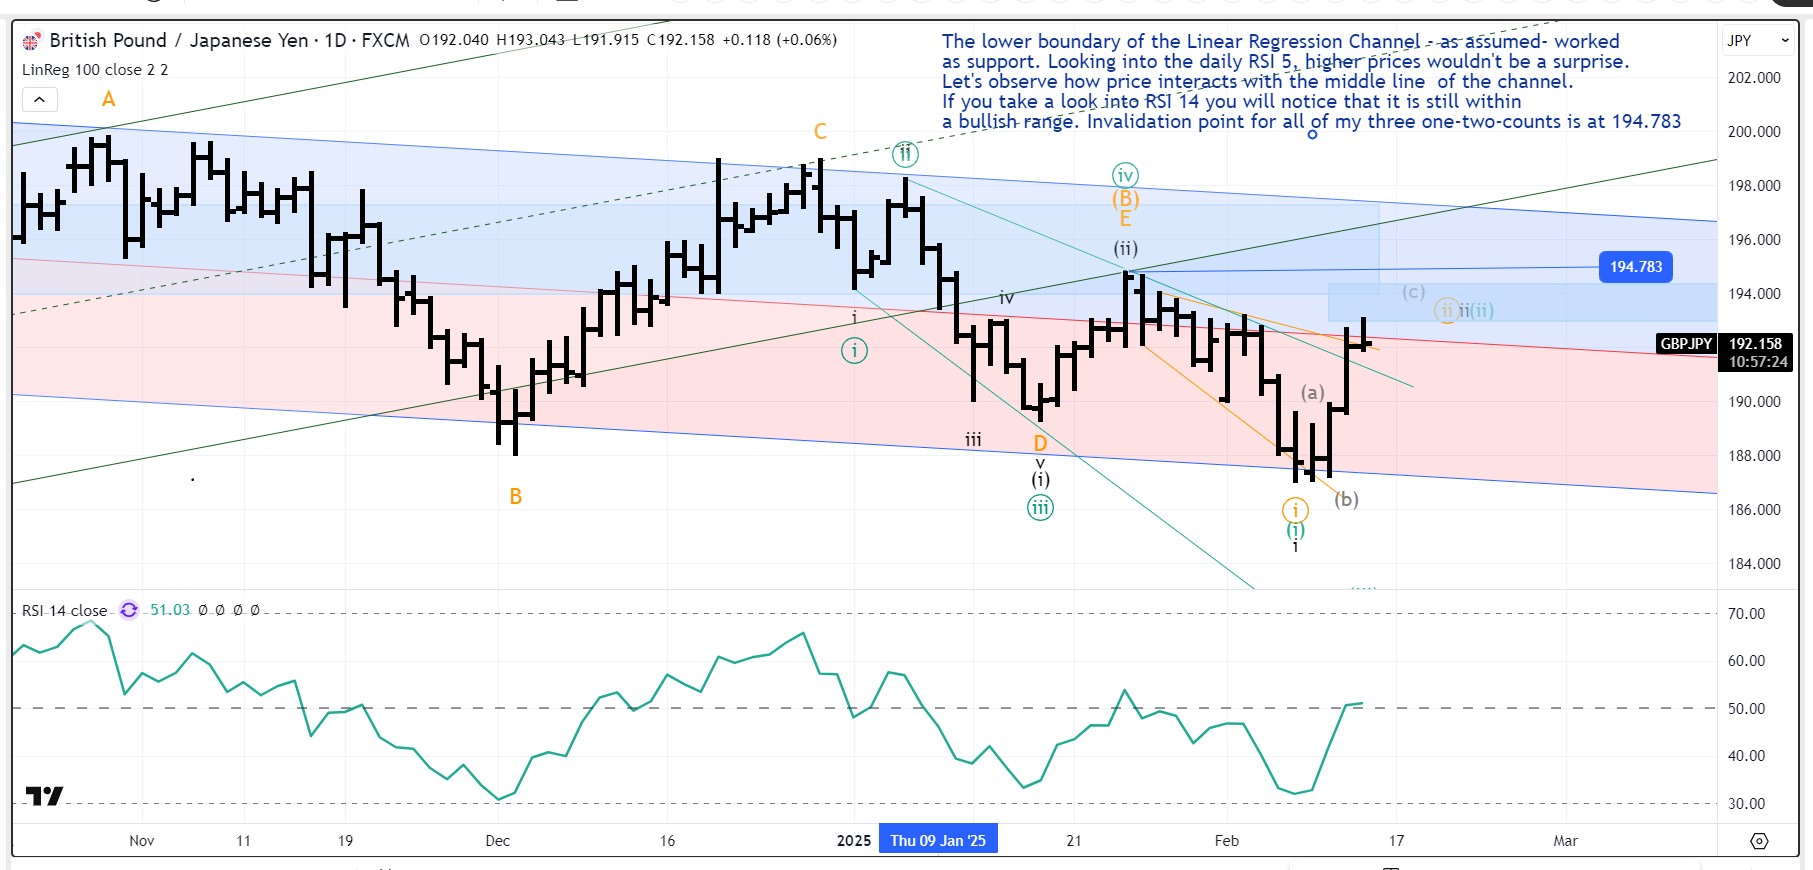
The lower boundary of the Linear Regression Channel – as assumed – worked as support. Looking into the daily RSI 5, higher prices wouldn’t be a surprise. Let’s observe how price interacts with the middle line of the channel. If …
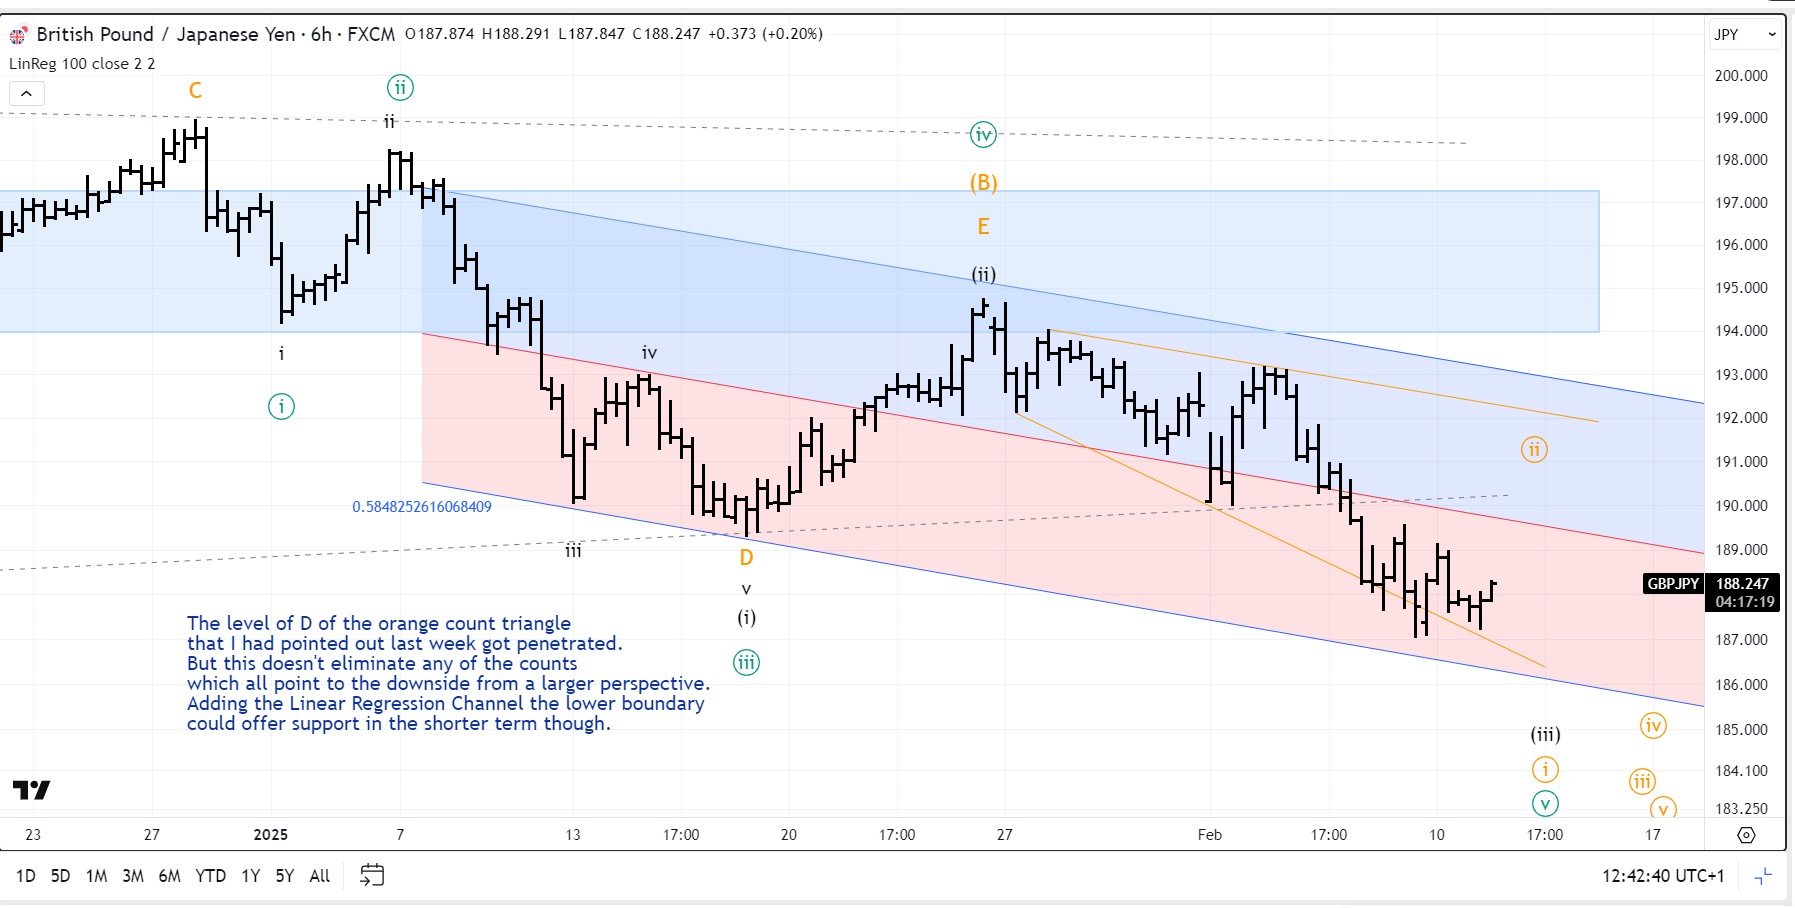
The level of D of the orange count triangle that I had pointed out last week got penetrated. But this doesn’t eliminate any of the counts which all point to the downside from a larger perspective. Adding the Linear Regression …

Price again found resistance at the blue rectangle area. Looking at the Linear Regression Channel we can observe that the channel is slightly pointing upwards and the middle line of this channel is offering resistance too. If you would like …

Prices went higher as expected. Looking at the RSI, the final channel and the Fib projection of micro ((4)) to project micro ((5)), I am assuming that we are currently looking at wave three of micro ((5)). A divergence in …

Taking a helicopter view, I doubt that the move up is still part of a correction with a wave (iv) in progress. To find an explanation, I changed the degrees. So instead of a wave (iii) in place at 2.789,85 …

Today I am presenting two alternate counts. Black count sees the whole correction from the low in August as a triangle. Wave E of (B) could be in place – if the low at 189.334 gets penetrated, it is possible …

Prices didn’t manage to penetrate the lower boundary of the black corrective channel. Both counts stay intact: looking for black ((y)) or red ((ii)) in progress. Sarah

It is possible that potential black (ii) is not yet in place. To explain that, I added the orange potential abc. Why: because yeterday’s low retraced 78% of potential orange a. Looking at Stochastic this count could be possible. Sarah

RSI in the intraday chart shows divergence between the top of potential 3 of (C) see red dashed line and potential wave three of 5 of (C) see blue dashed line. A price target protection using the positive reversal I …